Ruby : add content for debugging ruby using vscode rdbg extension #30267
+236
−6
There are no files selected for viewing
This file contains hidden or bidirectional Unicode text that may be interpreted or compiled differently than what appears below. To review, open the file in an editor that reveals hidden Unicode characters.
Learn more about bidirectional Unicode characters
This file contains hidden or bidirectional Unicode text that may be interpreted or compiled differently than what appears below. To review, open the file in an editor that reveals hidden Unicode characters.
Learn more about bidirectional Unicode characters
| Original file line number | Diff line number | Diff line change |
|---|---|---|
| @@ -0,0 +1,221 @@ | ||
|
|
||
| ### Introduction | ||
|
|
||
| In this lesson, we'll cover how to debug your ruby code using VSCode. | ||
|
|
||
| ### Lesson overview | ||
|
|
||
| This section contains a general overview of topics that you will learn in this lesson. | ||
|
|
||
| - Install vscode-rdbg extension. | ||
| - Setup VSCode debugger. | ||
| - Configure VSCode debugger. | ||
| - Add breakpoints without editing source code. | ||
| - Run and Debug code using VSCode. | ||
|
|
||
| ### Debugging with vscode-rdbg | ||
|
|
||
| #### Step 1: Installation | ||
|
XAJX179 marked this conversation as resolved.
Outdated
|
||
|
|
||
| 1. Go to your [VSCode Extensions](https://code.visualstudio.com/docs/editor/extension-marketplace) and install the [Ruby LSP](https://marketplace.visualstudio.com/items?itemName=Shopify.ruby-lsp) extension. This is an LSP (Language Server Protocol) which gives you autocompletion as you type ruby code in your editor along with some other useful features. | ||
|
XAJX179 marked this conversation as resolved.
Outdated
|
||
|
|
||
| 1. Before installing `vscode-rdbg` extension let's fulfill its requirements first. | ||
| You need to install the latest `debug` gem and `rdbg` command should be in `$PATH` environment variable. A command in `$PATH` can be called from any directory. | ||
|
XAJX179 marked this conversation as resolved.
Outdated
|
||
|
|
||
| ```shell | ||
| gem install debug | ||
| ``` | ||
|
|
||
| ```shell | ||
| which rdbg | ||
| # /home/yourusernamehere/.rbenv/shims/rdbg | ||
|
Contributor
There was a problem hiding this comment. Reminder to myself: check that the rbenv shim path is the same on MacOS. (you don't have to do anything with this yet, and I'll resolve this comment if nothing needs to change). |
||
| ``` | ||
|
|
||
| If you don't see path output like the comment above ask for help in our [Discord community](https://discord.gg/fbFCkYabZB). | ||
|
|
||
| 1. Now install the [VSCode rdbg Ruby Debugger](https://marketplace.visualstudio.com/items?itemName=KoichiSasada.vscode-rdbg) extension. | ||
|
|
||
| #### Step 2: Setup | ||
|
XAJX179 marked this conversation as resolved.
Outdated
|
||
|
|
||
| 1. Set version manager. | ||
|
|
||
| 1. Open VScode. | ||
| 1. Press <kbd>Ctrl</kbd> + <kbd>,</kbd> to open settings. | ||
| 1. Search "rdbg ruby version manager". | ||
| 1. Set it to `rbenv` which we made you install in [installing ruby lesson](https://www.theodinproject.com/lessons/ruby-installing-ruby#step-21-install-rbenv). It's your version manager for ruby: [rbenv documentation](https://github.com/rbenv/rbenv). | ||
| 1. Search "ruby lsp version manager" | ||
| 1. Click on the 'Edit in `settings.json`' link | ||
| 1. Edit the identifier, which by default is set to "auto", to "rbenv" | ||
|
|
||
| 1. Confirm settings.json have these two configurations set correctly: | ||
|
|
||
| ```json | ||
| { | ||
| "rdbg.rubyVersionManager": "rbenv", | ||
| "rubyLsp.rubyVersionManager": { | ||
| "identifier": "rbenv" | ||
| }, | ||
| } | ||
| ``` | ||
|
|
||
|
XAJX179 marked this conversation as resolved.
Outdated
|
||
| #### Step 3: Get some bugs | ||
|
|
||
| Let's Add Some code files for demo: | ||
|
|
||
| 1. Go to Desktop `cd ~/Desktop/` and create a new folder `mkdir dummy_name`. | ||
| 1. Open the folder in VSCode `code dummy_name/` | ||
| 1. Create new file `main.rb` inside `dummy_name/` and copy the following code containing some bugs: | ||
|
|
||
| ```ruby | ||
| # check if password is correct | ||
| def check_password(input) | ||
| password = 'xajxwashere' | ||
| if input = password | ||
| puts "Access granted!" | ||
| else | ||
| puts "Wrong password." | ||
| end | ||
| end | ||
|
|
||
| def start_password_input | ||
| puts "Enter a password:" | ||
| input = gets.chomp | ||
| puts "result : #{check_password(input)}" | ||
| end | ||
|
|
||
| # give day name of the given day number | ||
| def day_name(num) | ||
| days = %w[Sunday Monday Tuesday Wednesday Thursday Friday Saturday] | ||
| if num >= 1 && num <= 7 | ||
| days[num] | ||
| else | ||
| "Invalid" | ||
| end | ||
| end | ||
|
|
||
| def start_day_name_input | ||
| puts "Enter day number (1–7):" | ||
| n = gets.to_i | ||
| puts "Day is #{day_name(n)}" | ||
| end | ||
| ``` | ||
|
|
||
| 1. Create another file `not_main.rb` inside `dummy_name/` and copy the following code into `not_main.rb` : | ||
|
|
||
| ```ruby | ||
| puts "Sup Odin Student" | ||
|
|
||
| def message_number(index) | ||
| index + 1 | ||
| end | ||
|
|
||
| 5.times do |index| | ||
| num = message_number(index) | ||
| puts "message number: #{num}" | ||
| end | ||
| ``` | ||
|
|
||
| #### Step 4: Create launch.json | ||
|
|
||
| 1. Press <kbd>Ctrl</kbd> + <kbd>Shift</kbd> + <kbd>D</kbd> to go to `Run And Debug` inside VSCode. | ||
| 1. Click 'create a launch.json file.' This file is used to configure our debugger. | ||
| 1. Select `Ruby (rdbg)` option on the pop-up menu. | ||
| 1. Close the 'launch.json' file tab and confirm that it's saved at this place `dummy_name/.vscode/launch.json`: | ||
|  | ||
|
|
||
| #### Step 5: Run Debugger | ||
|
|
||
| 1. Open `not_main.rb` file and press <kbd>F5</kbd> OR on the menu bar click `Run` and inside it `Start Debugging`. By default the file currently opened will be used to start debugging, you will see a pop-up with command running the current file since we don't wanna pass any parameter to `rdbg` just press enter. (You can also set `askParameters` inside the `launch.json` to `false` which will skip this pop-up.) | ||
| 1. You can toggle the `Debug Console Output` using <kbd>Ctrl</kbd> + <kbd>Shift</kbd> + <kbd>Y</kbd>. | ||
| 1. Confirm the code outputs inside `Debug Console Output` like this: | ||
|  | ||
| 1. Move your mouse pointer to the left side of line number 7 and then left click to add a breakpoint: | ||
|  | ||
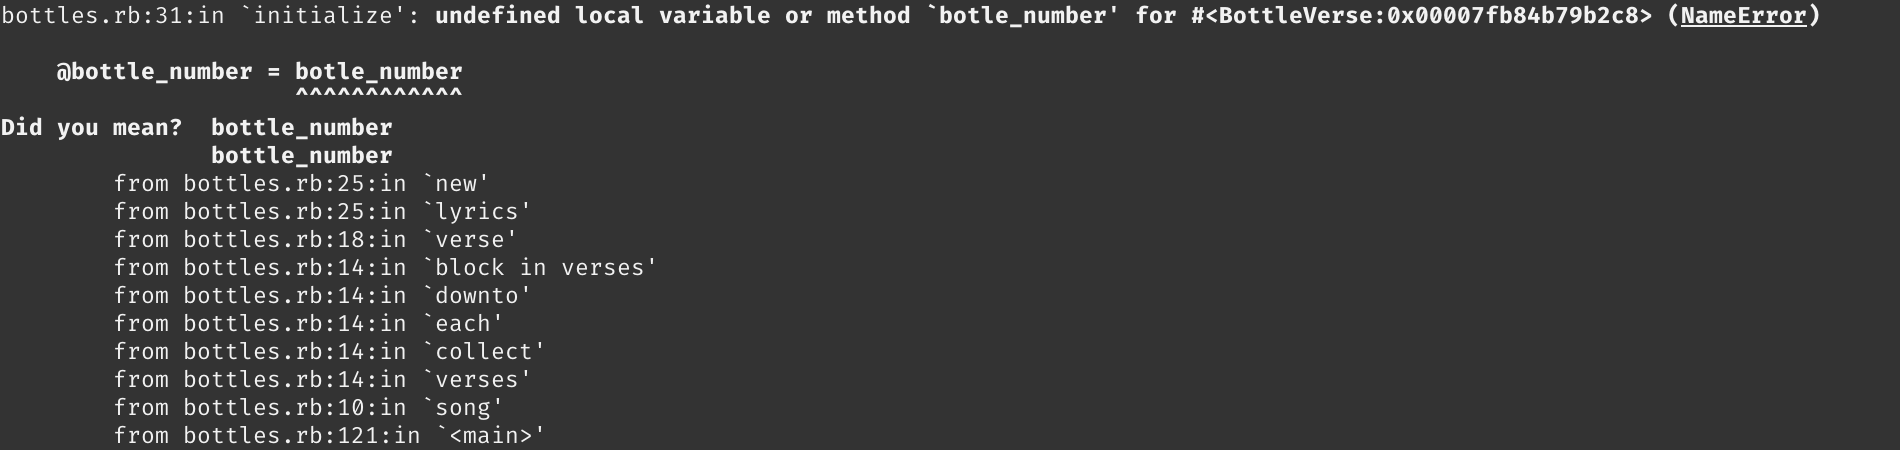
| 1. Run Debugger again by pressing <kbd>F5</kbd>, the debugger will stop the program on our breakpoint and give us some debugging actions to use. | ||
|  | ||
| 1. Read details of the commonly used debugging actions: | ||
|
|
||
| | Action | Description | | ||
| |:--|:--| | ||
| | Continue / Pause <kbd>F5</kbd> | **Continue**: Resume normal program/script execution (up to the next breakpoint). **Pause**: Inspect code executing at the current line and debug line-by-line. (for short and fast programs you might not get the chance to pause quickly and code will execute fully) | | ||
| | Step Over <kbd>F10</kbd> | Execute the next method as a single command without inspecting or following its component steps. | | ||
| | Step Into <kbd>F11</kbd> | Enter the next method to follow its execution line-by-line. | | ||
| | Step Out <kbd>Shift</kbd> + <kbd>F11</kbd> | When inside a method or subroutine, return to the earlier execution context by completing remaining lines of the current method as though it were a single command. | | ||
| | Restart <kbd>Ctrl</kbd> + <kbd>Shift</kbd> + <kbd>F5</kbd> | Terminate the current program execution and start debugging again using the current run configuration. | | ||
| | Stop <kbd>Shift</kbd> + <kbd>F5</kbd> | Terminate the current program execution. | | ||
|
|
||
| 1. While watching local variables in the `VARIABLES` window of `Run And Debug` which is by default on the left side and also keeping `Debug Console Output` opened, keep pressing <kbd>F11</kbd> OR `Step Into` button and follow the code execution line-by-line, this file was only for introduction there are no bugs in it so start reading next step. | ||
|
|
||
| #### Step 6: Debug some code | ||
|
|
||
| 1. Open `main.rb` and press <kbd>F5</kbd> to start debugger, notice the debugger disconnected immediately without running any code. | ||
| 1. This is because currently the `main.rb` file is only defining methods using the `def method_name ... end` syntax but no method is being called in this file, so let's call a method: | ||
|
|
||
| Add this at the end of file to call `start_password_input` method: | ||
|
|
||
| ```ruby | ||
| # calling the method | ||
| start_password_input | ||
| ``` | ||
|
|
||
| 1. Put a breakpoint on method call and press <kbd>F5</kbd> to start debugger, When you keep stepping into you will notice in the `Debug Console Output` the program will ask you for user input, but there's a problem you can't enter any input here. | ||
| 1. If your program needs user input we have to use `Terminal` instead of `Debug Console Output` so we can enter input while debugging, for that we have to configure our debugger so open `launch.json` at `dummy_name/.vscode/launch.json` and add `"useTerminal": true` at end of config named `Debug current file with rdbg` like this: | ||
|
|
||
| ```json | ||
| { | ||
| "type": "rdbg", | ||
| "name": "Debug current file with rdbg", | ||
| "request": "launch", | ||
| "script": "${file}", | ||
| "args": [], | ||
| "askParameters": true, | ||
| "useTerminal": true | ||
| }, | ||
| ``` | ||
|
|
||
| 1. Open `main.rb` and put a breakpoint on method call (if there isn't already), press <kbd>F5</kbd> to start debugging. | ||
| 1. Keep Stepping Into till you hit the user input line (`Step Into` one more time if you see still yellow background on the gets.chomp line), open `Terminal` (if it's not opened already) using <kbd>Ctrl</kbd> + <kbd>`</kbd> and enter any input inside the "Ruby Debug Terminal". | ||
| 1. You can now debug while giving user input in between. Keep stepping into until you reach the `if` condition. `Step Into` one more time and notice the flow. It passed the condition and went the true/truthy branch of the `if` statement. In the local variables we see that instead of having compared the values of the `input` and `password` variables, the `input` variable got assigned the value of the `password` variable. Can you guess the fix? Drop your answer in [TOP Discord's #ruby-rails-general channel](https://discord.com/channels/505093832157691914/690591236922409012). | ||
|
|
||
| #### Step 7: Debug some more code | ||
|
|
||
| 1. Open `main.rb` and comment out `start_password_input` method call. Add `start_day_name_input` at end of file : | ||
|
|
||
| ```ruby | ||
| # start_password_input | ||
| start_day_name_input | ||
| ``` | ||
|
|
||
| 1. Run the debugger and on user input enter "7". | ||
| 1. Notice the output is only "Days is" and no name after it. | ||
| 1. Put a breakpoint on the method call if there isn't one already. Run the debugger and on user input enter "7" again. | ||
| 1. Keep Stepping into till the `if` condition line and press `Step Into` one more time. | ||
| 1. Notice how the condition passes, meaning `"7"` is a valid input. So we've isolated the problem to `days[num]`. | ||
| 1. In the `WATCH` window of `Run And Debug` inside VSCode, click "add expression" (the plus icon) and add `days[num]`, and you will see the value returned by `days[num]` is `nil`. (use mouse to hover over `WATCH` to get "add expression" button) | ||
| 1. Add `days` and `num` to `WATCH` too, click on `days` to expand it and notice the array index starts with 0 and ends at 6. Currently the `num` 7 is out of range. | ||
| 1. The `WATCH` section can evaluate expressions, and it's helpful when the local variable you want to check is deeply nested. When checking inside local variable of `VARIABLES` window, let's try some expressions inside `WATCH` to figure out some working code for the `days[num]` bug. Add `days[num+1]` and `days[num-1]` to `WATCH` , local variables will show you just the current value of a variable, and using `WATCH` expressions, you can play with your variables and check the value of conditions like `num >= 1 && num <= 7`. Add this condition to `WATCH` and it will show `true` if `num` is greater than 0 and smaller than 8 else `false`. Notice the fix for this bug is using `days[num-1]` since allowed inputs are 1-7 and array index are 0-6. | ||
|
|
||
| ### Assignment | ||
|
|
||
| <div class="lesson-content__panel" markdown="1"> | ||
|
|
||
| 1. Let's practice by completing the debugging exercises from the [ruby-exercises repo](https://github.com/TheOdinProject/ruby-exercises/tree/main/ruby_basics#readme) again using vscode-rdbg this time. | ||
|
|
||
| </div> | ||
|
|
||
| ### Knowledge check | ||
|
|
||
| The following questions are an opportunity to reflect on key topics in this lesson. If you can't answer a question, click on it to review the material, but keep in mind you are not expected to memorize or master this knowledge. | ||
|
|
||
| - [Extension used for debugging ruby in VSCode.](#step-1-installation) | ||
| - [How to Run debugger.](#step-6-debug-some-code) | ||
| - [Version managar.](#step-2-setup) | ||
| - [Configuration file `launch.json`.](#step-4-create-launchjson) | ||
| - [Debug code which uses `gets` for user input.](#step-6-debug-some-code) | ||
| - [What is `WATCH`.](#step-7-debug-some-more-code) | ||
|
|
||
| ### Additional resources | ||
|
|
||
| This section contains helpful links to related content. It isn't required, so consider it supplemental. | ||
|
|
||
| - It looks like this lesson doesn't have any additional resources yet. Help us expand this section by contributing to our curriculum. | ||
Oops, something went wrong.
Add this suggestion to a batch that can be applied as a single commit.
This suggestion is invalid because no changes were made to the code.
Suggestions cannot be applied while the pull request is closed.
Suggestions cannot be applied while viewing a subset of changes.
Only one suggestion per line can be applied in a batch.
Add this suggestion to a batch that can be applied as a single commit.
Applying suggestions on deleted lines is not supported.
You must change the existing code in this line in order to create a valid suggestion.
Outdated suggestions cannot be applied.
This suggestion has been applied or marked resolved.
Suggestions cannot be applied from pending reviews.
Suggestions cannot be applied on multi-line comments.
Suggestions cannot be applied while the pull request is queued to merge.
Suggestion cannot be applied right now. Please check back later.
Uh oh!
There was an error while loading. Please reload this page.